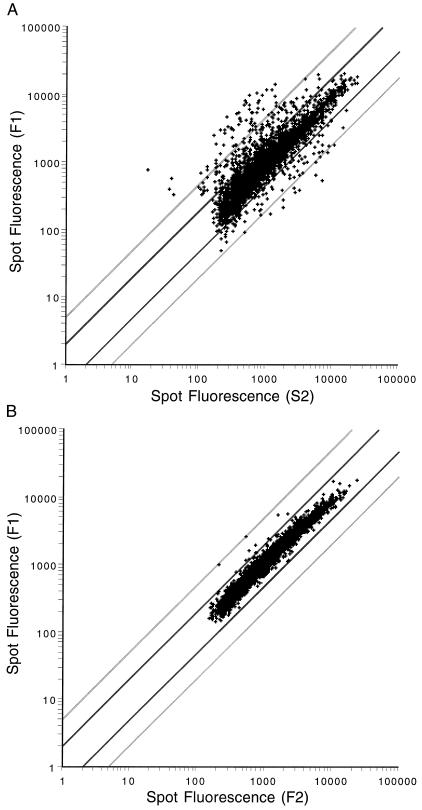
Figure 2.
Log-log scatterplot of fluorescence measured for mRNA labeled with either cyanine-3 or cyanine-5 fluorochrome in a competitive hybridization on a microarray containing 6218 ORFs. Spots with at least one fluorescence signal significantly above background are plotted for (A) F1 against S2 and (B) F1 against F2. Dark lines represent a 2-fold difference in expression; light lines represent a 5-fold difference in expression.

