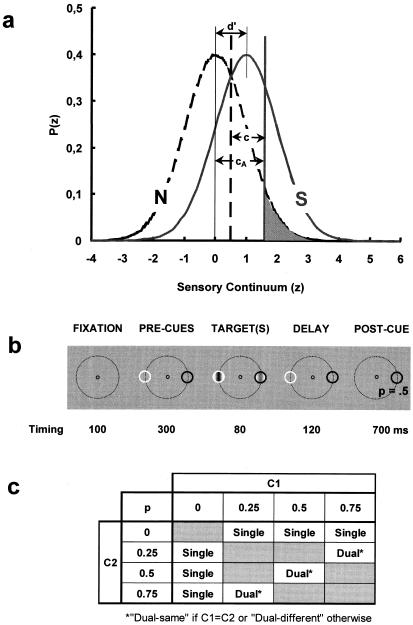
Figure 1.
(a) The Signal Detection Theory (1) framework for the dual-criterion experiment. Gaussian functions describe the probability density, P(z), of the internal response distributions (in standard z-scores; abscissa) for the noise [N: PN(z)] alone (dashed curve) and for the signal + noise [S: PS(z)]. Thin vertical lines show their means with sensitivity (d′ = zHit − zFA, with zHit and zFA the z scores for the observed correct target detection and false alarm rates) being the distance between these means (d′ = 1 in this case) measured in units of the noise standard deviation, σN, and assuming that N and S are normally distributed with σ = σN = σS. We define an “absolute” criterion as cA = −zFA. Defined in this way, criteria are independent of the univariance assumption (i.e., σS = σN), because they depend on the N distribution only. The corresponding values of the likelihood ratio criterion, β = Ps(z = cA)/PN(z = cA), characterize observers' response bias independently of d′. Error rate is minimized when β = PN/PS, (with PN and PS the a priori N and S probabilities) but experimental results show that observers adopt a more conservative behavior with βs closer to one (1). The vertical dashed and continuous heavy lines show optimal criteria for PS = 0.5 and PS = 0.25, respectively. The shaded area denotes the False Alarm (FA) rate for the latter case. (b) One trial sequence as detailed in the text. (c) The 12 experimental conditions as characterized by the combination of two distinct stimuli of contrast C1 and C2 and of four stimulus probabilities.

