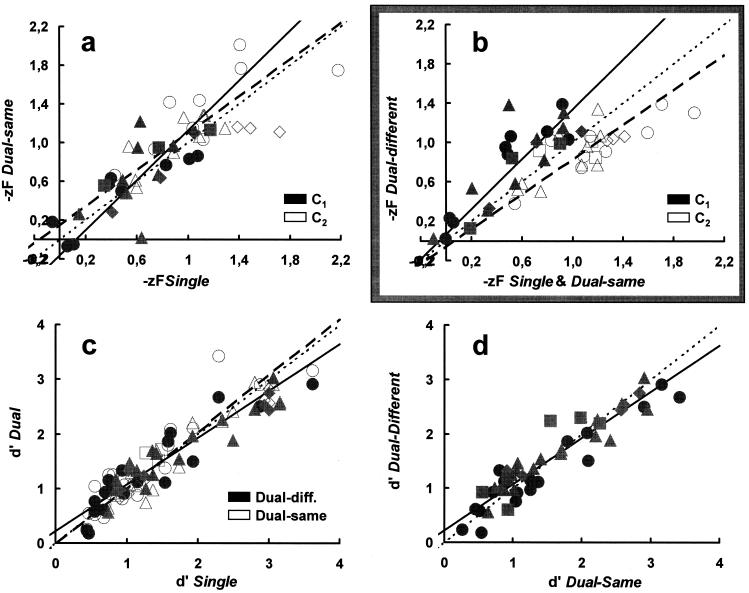
Figure 2.
Correspondence between criteria (a and b) and d′s (c and d) assessed under single, dual-same, and dual-different conditions. Different symbols are for different observers. Data points represented by identical symbols are for different stimulus probabilities and/or contrasts. (a and b) Solid and open symbols show the absolute criteria obtained for the low (C1) and high (C2) contrasts, respectively, in a stimulus pair. (a) cA[single] vs. cA[dual-same] comparison. The identity locus is shown as the dotted (slope 1) line. Solid and dashed regression lines are fits with errors in both coordinates (5) through the solid (C1 stimuli) and open (C2 stimuli) symbols, respectively. (b) As in a but for the cA[mean (single + dual-same)] vs. cA[dual-different] comparison. Note the upward and downward shifts of the dual-different criteria associated with low (solid symbols) and high (open symbols) contrasts, respectively, in a stimulus pair. (c) d′[single] vs. d′[dual] comparison with closed (solid regression line) and open (dashed regression line) symbols showing dual-different and dual-same data, respectively. The identity line is dotted. (d) d′[dual-same] vs. d′[dual-different] comparison. The identity and the regression line through all experimental points are dotted and solid, respectively.

