
Figure 1.
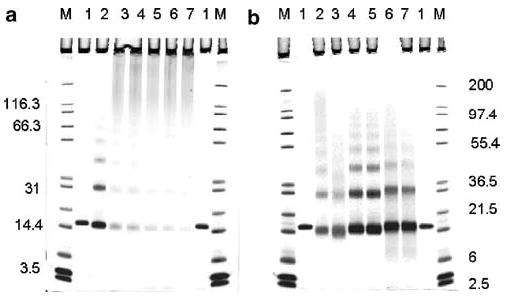
(a) SDS–PAGE of RNase A at 6.5 mg/ml before (lane 1) and after incubation in 10% buffered formalin for 0.3 (lane 2), 23.4 (lane 3), 47.5 (lane 4), 71.9 (lane 5), 138.8 (lane 6), and 210.5 (lane 7) h at 23°C. (b) SDS–PAGE of native RNase A at 1 mg/ml (lane 1) and 5% formaldehyde-modified RNase A having undergone different treatments (lanes 2–7). Lanes: 2, reaction mixture; 3, reaction mixture after DSC; 4 and 5, reaction mixture after 1 and 4 days of dialysis; 6 and 7, as 4 and 5, but recovered after DSC; M, molecular mass markers, kDa.