
Figure 8.
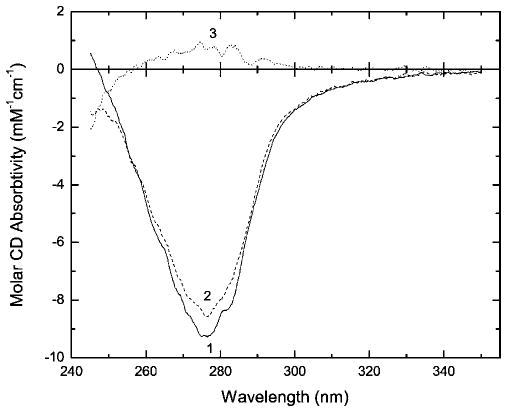
Near-UV CD spectra of native RNase A (profile 1) and RNase A (6.5 mg/ml) kept in 10% buffered formalin (pH 7.4) at 23°C for 210.5 h (profile 2), and their difference spectrum (profile 3). Spectrum 2 was recorded from a 10-fold diluted aliquot of the reaction mixture.