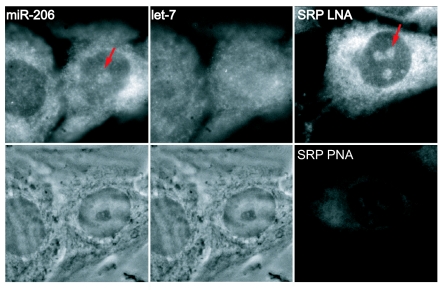
Fig. 1.
In situ hybridization pattern of miR-206 compared with let-7 and SRP RNA. (Upper) Distribution of signal after in situ hybridization using LNA probes to miR-206, let-7, and SRP RNA. Images are not scaled to the same intensity ranges. All probes were cy3-labeled except let-7, which was fluorescein-labeled; miR-206 and let-7 patterns are shown after a dual hybridization experiment. (Lower) The corresponding phase images for miR-206 and let-7. (Lower Right) The hybridization pattern to SRP RNA using a peptide nucleic acid probe. PNA, peptide nucleic acid. Arrows point to the nucleolus. Each image is 35 μm wide.

