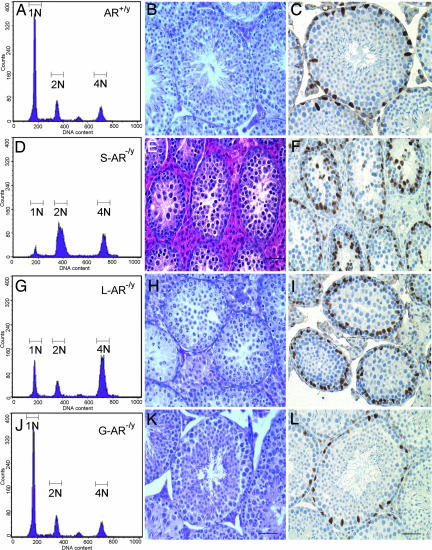
Fig. 5.
Flow cytometric analyses, morphology analyses, and GATA-1 staining in testes of AR+/y, S-AR−/y, and T-AR−/y. (A, D, G, and J) Analysis of germ cell DNA content of AR+/y, S-AR−/y, L-AR−/y, and G-AR−/y mice by using flow cytometry. N1 represents haploid cells, N2 represents diploid cells, and N3 represents tetraploid cells. Compared with the AR+/y testis (A), the S-AR−/y testis showed a 3-fold increase in diploid cells, a 2-fold increase in tetraploid cells, and an 11-fold reduction in haploid cells (D); the L-AR−/y testes showed a 4-fold increase in tetraploid cells and a 2.8-fold reduction in haploid cells (G). There were similar distributions of DNA content histogram peaks between the G-AR−/y (J) and AR+/y testis. (B, E, H, and K) Testicular morphology analysis of 14-week-old mice. Compared with the AR+/y testis (B), the S-AR−/y testis showed no lumen formation in seminiferous tubules, and germ cell development stopped at the pachytene/diplotene primary spermatocyte stage of the first meiosis division (E); L-AR−/y testes showed no lumen formation in seminiferous tubules, and germ cell development stopped at the stage around the secondary spermatocyte to round spermatid; no elongated spermatid or released spermatozoa can be found (H); the G-AR−/y testis (K) showed relatively comparable seminiferous tubule diameters and a full range of germ cell development. (C, F, I, and L) Pathomicrographs illustrating the distribution of Sertoli (GATA-1 immunopositive; brown staining) cell nuclei in a 14-week-old mouse testis. GATA-1-immunopositive Sertoli cell nuclei located at the basal portion of the seminiferous tubules in AR+/y, L-AR−/y, and G-AR−/y testes (C, I, and L). However, the locations of GATA-1-immunopositive Sertoli cell nuclei are disorganized and dislocalized in S-AR−/y testes (F). (Scale bar, 50 μm.)

