Fig. 1.
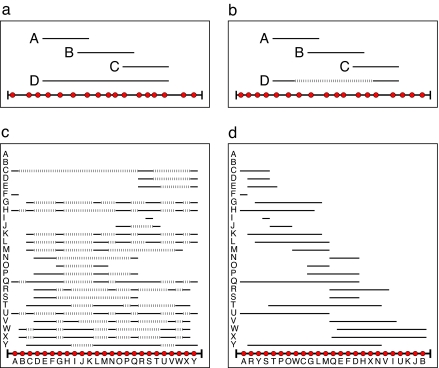
Illustration of interval and noninterval food webs. Species (red circles) are placed along a single dimension, which we denote the resource axis. For each predator (A–D) a line is placed above the prey (resources) it consumes. (a) A food web is interval if there exists a permutation of the species along the resource axis such that for each predator, the diet is contiguous. (b) A food web is noninterval if no permutation exists for which all diets can be represented as contiguous segments. (c) An unordered food web. The resource axis is shown along the bottom, and each red circle represents a species in the ecosystem. For each species in the vertical axis, we represent predation by a solid horizontal line (for example, C consumes A) and nonpredation by the dashed lines (for example, C does not consume B). The total number of gaps for this particular ordering is  = 217. (d) An ordered food web. Our algorithm works by swapping the location of two nodes within the ordering in an attempt to minimize the value of
  . In this particular case, one can find an ordering with
  = 0. It should be noted that this is one of potentially multiple permutations that can give rise to the same value Ĝ = G = 0.

