Fig. 2.
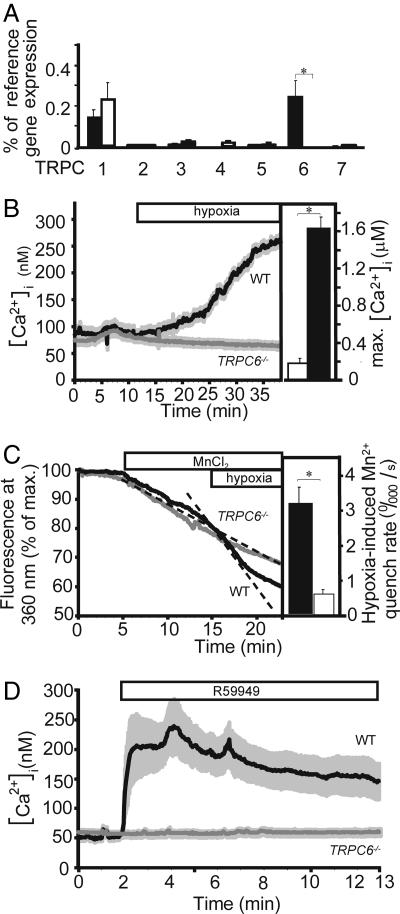
TRPC expression analysis of, and cation influx in, PASMCs from WT and TRPC6−/− mice. (A) Total RNA was prepared from primary cultured precapillary pulmonary artery SMCs of WT (n = 3 mice) and TRPC6-deficient (TRPC6−/−, n = 3 mice) mice and reverse-transcribed. Products of the first strand synthesis were analyzed for the presence of amplification products obtained with primer pairs described in Materials and Methods. mRNAs coding for TRPCs and β-actin (as reference gene) were quantified with the aid of a light cycler. Values are presented as percentage of reference mRNA expression (β-actin mRNA expression). Except for TRPC6 expression (P < 0.05), no significant expression differences in WT and TRPC6−/− cells were observed (P > 0.05). (B–D) Cation influx in PASMCs from WT and TRPC6−/− mice. (B Left) Increase in [Ca2+]i upon exposure to hypoxia. Primary cultured PASMC were loaded with fura-2 and analyzed by single-cell fluorescence imaging. A horizontal bar indicates hypoxic superfusion of the cells. ET-1 (4 nM) was added 5 min after starting the experiment and was present during the remainder of the experiment. Data are from n = 15 WT and n = 55 TRPC6−/− cells from four mice each. (B Right) Maximal [Ca2+]i in PASMC (n = 6 cells) from TRPC6-deficient mice infected with AAVs coding for TRPC6-EGFP (a fusion protein of TRPC6 and the EGFP) before (open bar) and after (filled bar) application of hypoxia. ET-1 (4 nM) was added 5 min after starting the experiment and was present during the remainder of the experiment. (C Left) Hypoxia-induced Mn2+ influx in TRPC6−/− and WT PASMC. Mn2+ (0.3 mM) was added to the Ca2+-containing bath solution, and hypoxia was applied to PASMC from WT (n = 4 cells) and a TRPC6−/− (TRPC6−/−, n = 4 cells) mice as indicated by bars. ET-1 (4 nM) was added 5 min after starting the experiment and was present during the remainder of the experiment. Time courses of total fura-2 fluorescence at the isosbestic wavelength are shown. Total fura-2 fluorescence corrected for background signals was recorded by exciting fura-2 at the isosbestic wavelength (360 nm) and normalized to the initial values of each single cell. Dashed lines indicate the initial slopes, i.e., the rates of fura-2 quenching by Mn2+. (C Right) Summary of Mn2+ influx experiments. Differences in the linear range of the Mn2+ quench rate after Mn2+ addition and after application of hypoxic conditions were calculated for WT (filled bars, n = 12 cells) and TRPC6−/− PASMC (open bars, n = 22 cells). ∗ significant difference (P < 0.05) between WT and TRPC6−/− mice. (D) Effects of a DAG kinase inhibitor II (R59949) on [Ca2+]i in WT versus TRPC6−/− PASMC. ET-1 (4 nM) was added 1 min after starting the experiment and was present during the remainder of the experiment. The DAG kinase inhibitor R59949 induced a rise in [Ca2+]i in WT cells (n = 15) but not in TRPC6−/− cells (n = 75).

