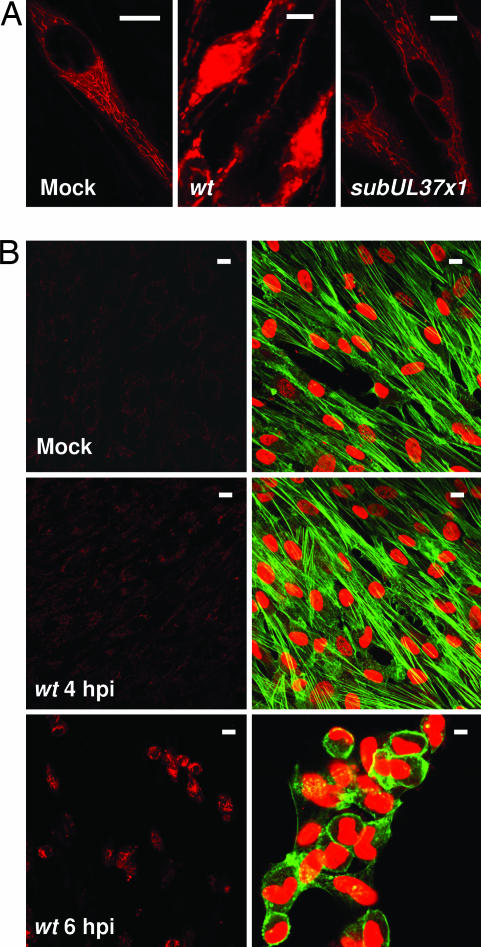
Fig. 4.
Altered Ca2+ localization correlates with F-actin reorganization. Infections were at a multiplicity of ≈1 pfu per cell, and living fibroblasts were imaged immediately after adding calcium orange (red signal). (A) Assays were performed at 24 h after mock, BADwt, or BADsubUL37x1 infection. (B) Calcium orange assays (Left) were performed at 4 h after mock infection or 4 or 6 h after BADwt infection. (Right) In a duplicate sample, DNA (red) and actin (green) were visualized. (Scale bars: ≈10 μm.)

