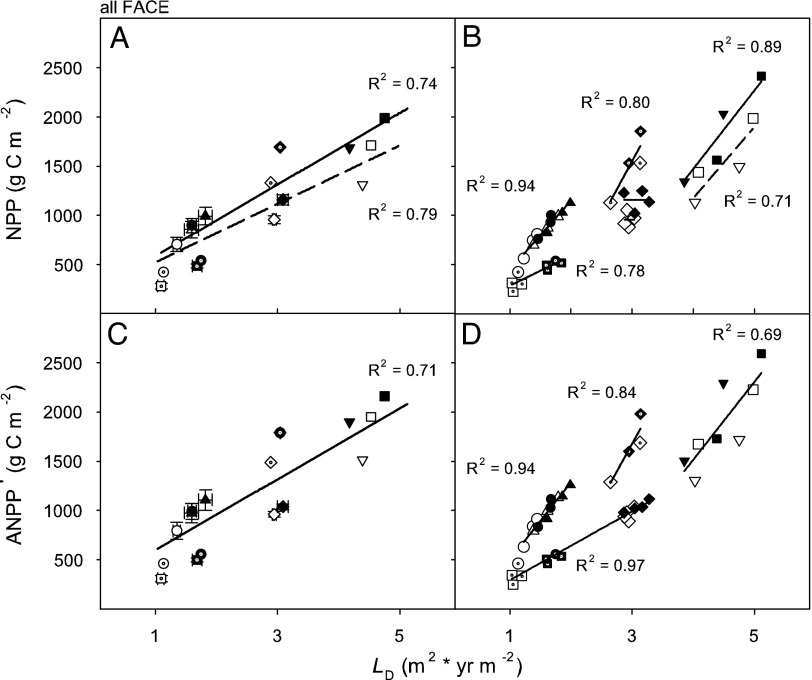
Fig. 3.
NPP (A and B) and ANPP′ (C and D) as functions of leaf-area duration (LD; m2 × yr m−2) at the four FACE sites. Regressions were fitted to the combined individual treatment-year data from the four sites, but treatment averages for all years within a site (with 1 SE) are shown (A and C). The treatment-year data for each site and the within-site regression fits are shown in B and D. Symbols for species: Duke FACE; P. taeda (circles for unfertilized, up triangles for fertilized), ORNL-FACE; L. styraciflua (diamonds), POP-EUROFACE; P. alba (inverted triangles), P. nigra (squares), Populus euramericana (diamonds with dot), AspenFACE; Populus tremuloides (circles with dot), P. tremuloides/Betula papyrifera (squares with dot), with filled symbols representing elevated [CO2]. For cases in which current and elevated [CO2] have different responses (in A and B), dashed and solid lines are used for these treatments, respectively.

