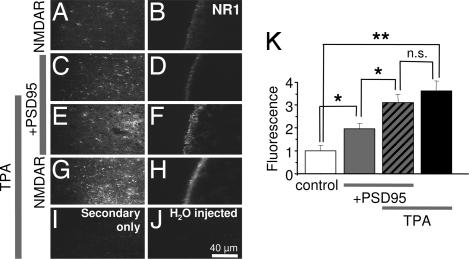
Fig. 4.
PSD-95 partially occludes PKC potentiation of surface NMDAR expression. Representative tangential (left column) and cross-sectional (right column) images of oocytes expressing NR1–4b/NR2A receptors in the absence (A and B) or presence (C and D) of PSD-95. (E–H) TPA increased NMDAR surface expression to nearly the same final value in the absence or presence of PSD-95. (I and J) Oocytes expressing NMDARs labeled with secondary antibody in the absence of primary antibody (I) or water-injected oocytes labeled as in A--H (J) showed negligible fluorescence. (K) Summary of data in A--J. ∗, P < 0.05; ∗∗, P < 0.01.

