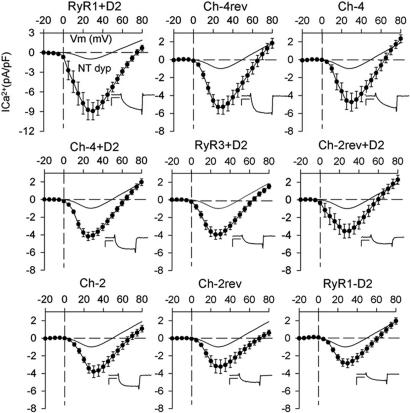
Fig. 4.
Average I–V curves for all chimeric constructs expressed in dyspedic cells. Constructs are “ranked” by their average peak current density from left to right and top to bottom. Symbols and error bars represent mean ± SE. (Insets) Current traces. [Scale bars: vertical, 4 pA/pF (RyR1+D2) and 2 pA/pF (all other graphs); horizontal, 75 ms.]

