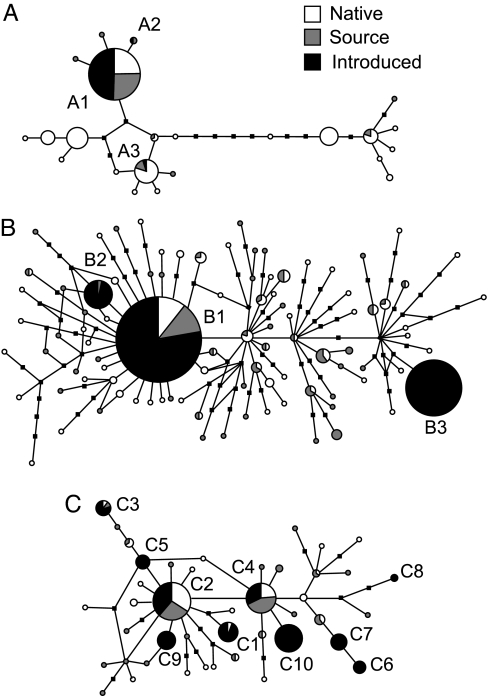
Fig. 2.
The haplotype networks of B. attramentaria and its trematode parasites (A), HL6 (B), and HL1 (C). Circle sizes are proportional to the number of individuals observed for each haplotype. The black squares represent unobserved single-nucleotide substitutions. The pie charts indicate the regions where samples were collected. Letters lie adjacent to the pie charts correspond to introduced haplotypes listed in Fig. 1A for B. attramentaria and Fig. 1 B and C for the two parasites.

