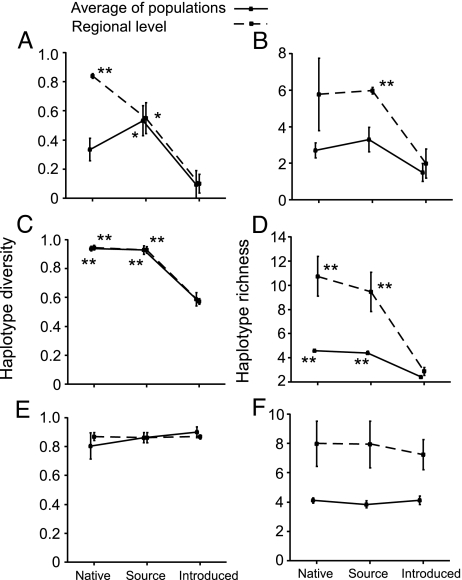
Fig. 3.
Changes in genetic diversity associated with introduction. Haplotype diversity is equivalent to expected heterozygosity for diploid data, and haplotype richness is the rarefied number of haplotypes in a sample. Plots on the left are of haplotype diversity across populations and that calculated for each region as a whole. Plots on the right are of haplotype richness across populations and that calculated for each region as a whole. The top two plots, A and B, are for the snail host, B. attramentaria; the middle two, C and D, are for the HL6 trematode; and the bottom two, E and F, are for the HL1 trematode. Error bars represent ±SEM. [∗ denotes significance only within a line against the introduced population; ∗, P < 0.05; ∗∗, P < 0.01 (actual P value in each test is listed in SI Table 3)].

