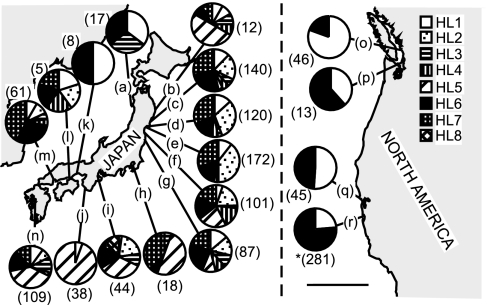
Fig. 4.
The distributions of genetically identified trematode parasites. The sample size is in parentheses. (Scale bar, 500 km.) Letters indicate sampling sites that are listed in Fig. 1. (We found two individuals of HL2 in Elkhorn Slough, however, representing <1% of the total sample).

