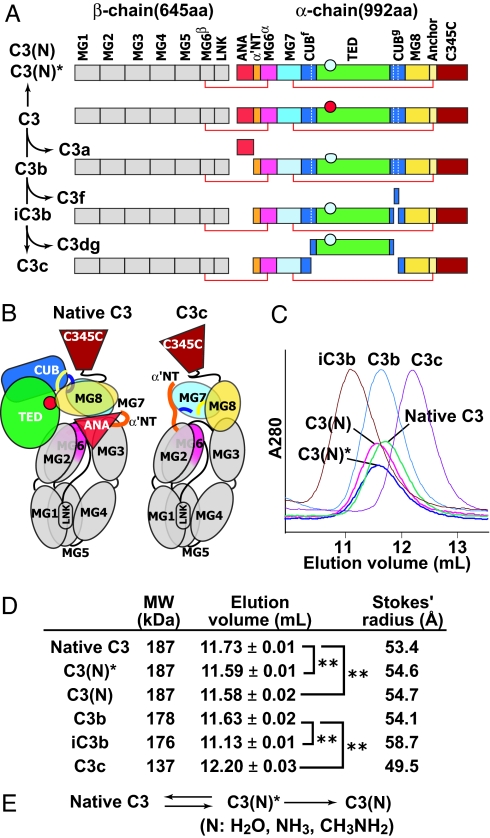
Fig. 1.
Complement C3 activation. (A) Primary structure of C3 and its products. The thioester group in the TED is shown as a circle before (red) or after (cyan) nucleophilic addition. (B) Domain architecture of C3 and C3c revealed by x-ray crystallography (12). Colors are the same as in A. (C) Overlaid elution profiles of C3 products in S200 size exclusion chromatography. (D) Hydrodynamic behavior of C3 and its products. Elution volume in S200 gel filtration was measured three times for each component. Stokes' radius was calculated from the elution positions of thyroglobulin, γ-globulin, BSA, ovalbumin, and chymotrypsinogen. ∗∗, P < 0.001. (E) The two-step reaction of C3 upon nucleophile (N) addition to the thioester.

