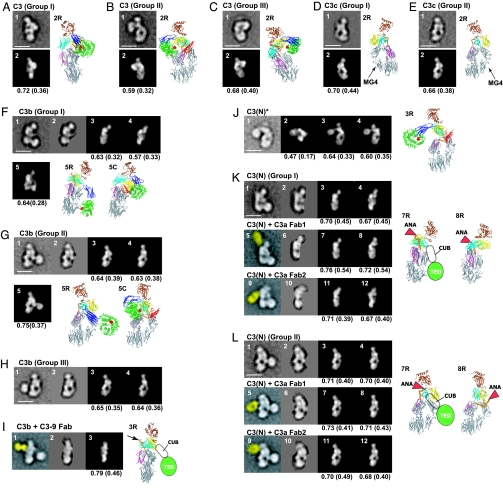
Fig. 3.
Cross-correlation between EM class averages and crystal structure projections. (A–E) C3 and C3c. The images represent EM averages (1) and the best correlating C3 or C3c projection (2). Ribbon diagrams in same orientation as a given image have R suffixes. (F–I) C3b and C3b complexed with C3–9 antibody. The images represent EM averages without (1) or with (2) masking, the best correlating C3c (3) or C3Δ (4) projections to the masked averages, two different C3b models made from C3c and C3 CUB domain and TED that correlate best with unmasked averages (5), the corresponding ribbon diagram (5R), and for comparison C3 in the same orientation (5C) superimposed by using MG domains 1, 2, 4, and 5. In I, the C3–9 Fab is highlighted in yellow (1), and the Fab binding site is indicated by an arrow in the corresponding ribbon diagram (3R). (J) C3(N)*. The images represent EM average (1), best correlating projections of C3 (2), model of C3 with TED and CUB domains manually repositioned (3), model of C3c with TED and CUB domains added (4), and ribbon diagram corresponding to image 3 (3R). (K and L) C3(N) and C3(N) complexed with C3a Fab 1 (from Quidel) and Fab 2 [H13 (30)]. The images represent EM averages without (1, 5, and 9) or with (2, 6, and 10) TED (and Fab) masked, the best correlating C3c (3, 7, and 11) or C3Δ (4, 8, and 12) projections to the masked averages, and corresponding C3c (7R) or C3Δ (8R) ribbon diagrams with positions of ANA and for C3c the CUB domain and TED schematically indicated. Corresponding ribbon diagrams for the Fab 2 complex are essentially identical in orientation to those in 7R and 8R. The Fab density in images 5 and 9 is highlighted in yellow.

