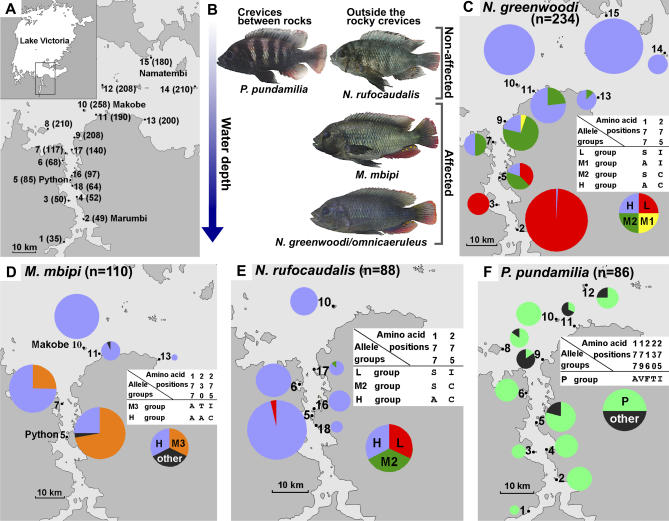
Figure 1. Maps and Frequencies of LWS Alleles.
(A) The study area in southern Lake Victoria. Arabic numerals indicate stations at which cichlids were collected. The Secchi disk water transparency (cm) at each station is shown in parentheses. The stations are: 1, Buyago Rocks; 2, Marumbi Island; 3, Matumbi Island; 4, Luanso Island; 5, Python (Nyamatala) Islands; 6, Kissenda Island; 7, Hippo Island; 8, Juma Island; 9, Bwiru Point; 10, Makobe Island; 11, Igombe Island; 12, Ruti Island; 13, Senga Point; 14, Sozihe Islands; 15, Namatembi Island; 16, Nyamatala (Nyameruguyu) Island; 17, Gabalema Islands; 18, north end of Luanso Bay. Where the local name differs from that used in previous publications, the local name is indicated in parenthesis.
(B) A representation of the microhabitat distribution of the studied species by water depth and between, as opposed to outside, the rocky boulders. Photos show males of the blue morph in nuptial coloration. “Affected” and “Non-affected” indicate the species with the LWS allele frequencies that are strongly affected and not strongly affected by variation in water transparency, respectively.
(C) LWS allele group frequencies in the populations of N. greenwoodi/omnicaeruleus.
(D) LWS allele group frequencies in the populations of M. mbipi.
(E) LWS allele group frequencies in the populations of N. rufocaudalis.
(F) LWS allele group frequencies in the populations of P. pundamilia.
In (B–E), Arabic numerals correspond to those in (A). The size of a pie indicates the number of haplotypes sequenced: N. greenwoodi: n = 58 at station 2; n = 10 at 3; n = 14 at 5; n = 10 at 7; n = 14 at 9; n = 22 at 11; n = 8 at 13; n = 8 at 14; n = 50 at 15, and N. omnicaeruleus, n = 40 at 10. M. mbipi: n = 36 at station 5; n = 32 at 7; n = 30 at 10; n = 10 at 11; n = 2 at 13. N. rufocaudalis: n = 42 at station 5; n = 16 at 6; n = 10 at 10; n = 10 at 16; n = 6 at 17; n = 4 at 18. P. pundamilia: n = 2 at station 1; n = 10 at 2; n = 4 at 3; n = 8 at 4; n = 18 at 5; n = 8 at 6; n = 6 at 8; n = 6 at 9; n = 10 at 10; n = 6 at 11; n = 8 at 12. The color of the sections of the pie indicates the frequency of allele groups L (red), M1 (yellow), M2 (green), H (blue), M3 (orange), P (blue-green), and other alleles (black). The amino acid differences among allele groups are shown for every species in the corresponding white panels.

