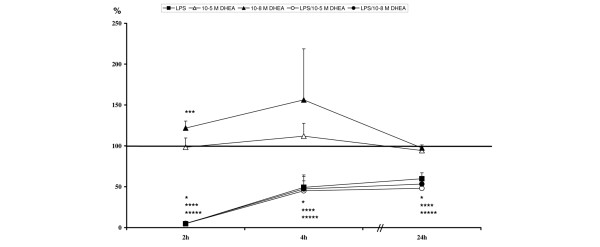
Figure 4.

Relative L-selectin expression levels: *lipopolysaccharide (LPS) significant compared to unstimulated; ***10-8 M dehydroepiandrosterone (DHEA) significant compared to unstimulated; ****LPS/10-5 M DHEA significant compared to unstimulated; *****LPS/10-8 M DHEA significant compared to unstimulated.
