
Figure 1.
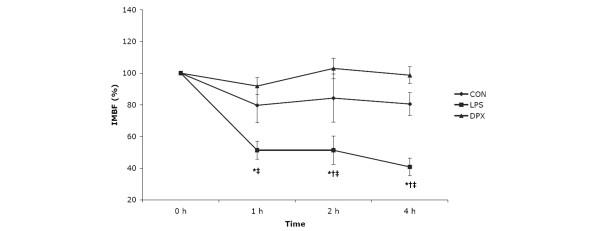
Intestinal microvascular blood flow. Shown is intestinal microvascular blood flow (IMBF) as a percentage of baseline; measurements taken at baseline (time point 0 hours) and at 1, 2 and 4 hours after the start of the experiment. CON, control group; DPX, DPX group (endotoxin plus dopexamine); LPS, LPS group (endotoxin infusion only). *P < 0.05 versus baseline; †P < 0.05 versus CON; ‡P < 0.05 versus DPX.