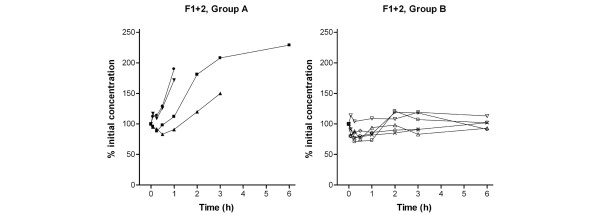
Figure 1.

Prothrombin fragment F1+2 during hemofiltration. Curves represent values of individual patients. Group A, patients demonstrating an increase in thrombin generation. Group B, patients with a constant level of thrombin generation. F1+2, prothrombin fragment F1+2.
