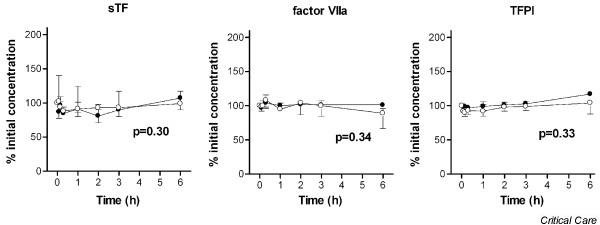
Figure 3.

Soluble tissue factor, activated factor VII and tissue factor pathway inhibitor during hemofiltration. Data points are median and interquartile ranges. Closed circles, patients with thrombin generation (group A); open circles, patients without thrombin generation (group B). P value represents the difference in time course between both groups by linear mixed models and during the first three hours of hemofiltration. sTF, soluble tissue factor; factor VIIa, activated factor VII; TFPI, tissue factor pathway inhibitor.
