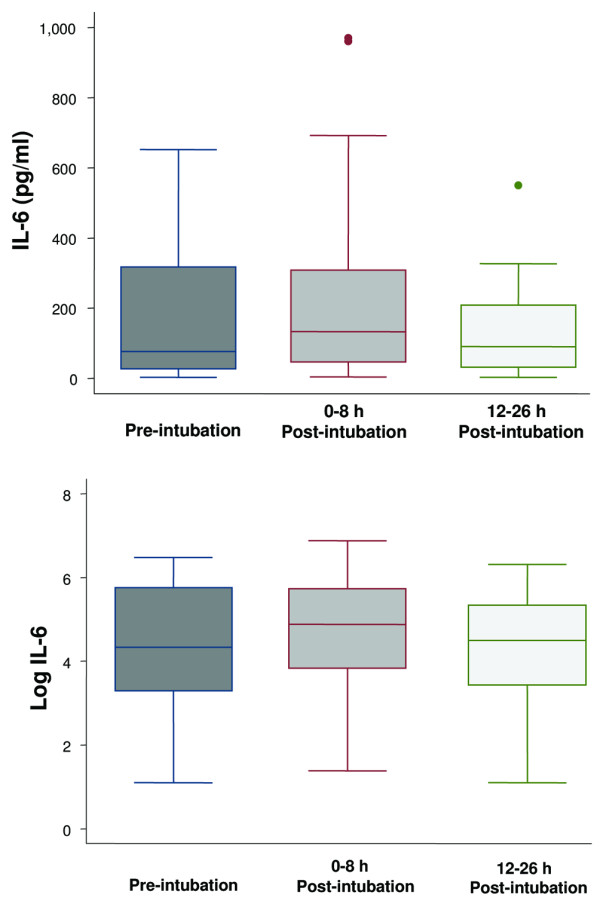
Figure 2.

Boxplot summary of interleukin (IL)-6 levels (upper panel) and boxplot summary of log-transformed IL-6 levels to achieve normal distribution (lower panel). Median levels of IL-6 were 76 pg/ml (range, 3 to 652 pg/ml) pre-intubation, 132 pg/ml (range, 4 to 971 pg/ml) immediately post-intubation, and 90 pg/ml (range, 3 to 550 pg/ml) at 12 to 26 hours post-intubation. The mean levels of IL-6 after log transformation were 4.4 ± 1.5 pg/ml, 4.7 ± 1.4 pg/ml, and 4.2 ± 1.5 pg/ml, respectively. There was no difference among the levels of IL-6 at the three different time points (p = 0.34). The horizontal line represents the median, the box encompasses the 25th to 75th percentile, and error bars encompass the 10th to 90th percentile.
