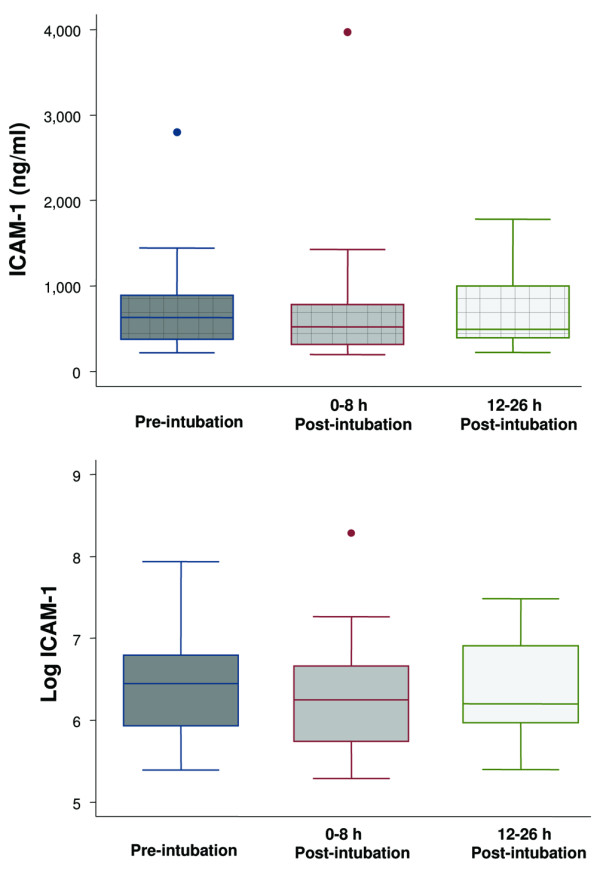
Figure 3.

Boxplot summary of intercellular adhesion molecule-1 (ICAM-1) levels (upper panel) and boxplot summary of log-transformed ICAM-1 levels to achieve normal distribution (lower panel). Median levels of ICAM-1 were 631 ng/ml (range, 220 to 2,800 ng/ml) pre-intubation, 520 ng/ml (range, 198 to 3,970 ng/ml) immediately post-intubation, and 492 ng/ml (range, 221 to 1,780 ng/ml) at 12 to 26 hours post-intubation. The mean levels of ICAM-1 after log transformation were 6.5 ± 0.6 ng/ml, 6.3 ± 0.7 ng/ml, and 6.4 ± 0.6 ng/ml, respectively. There was no statistically significant difference among the levels of ICAM-1 at the three different time points (p = 0.15). The horizontal line represents the median, the box encompasses the 25th to 75th percentile, and error bars encompass the 10th to 90th percentile.
