
Figure 2.
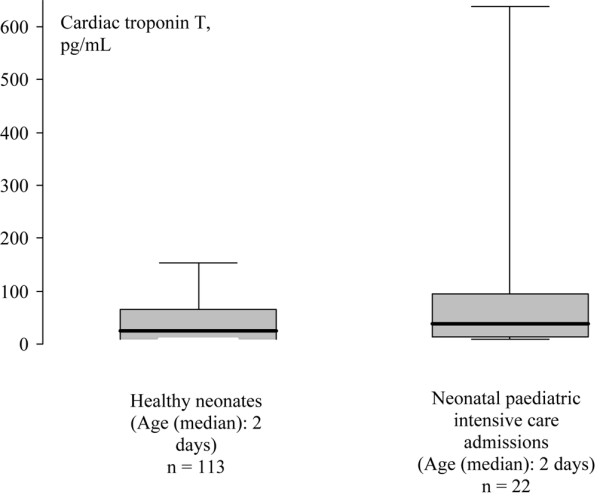
Box and whisker plots for cardiac troponin T values in healthy neonates (data taken from [9]) and neonatal paediatric intensive care admissions. The boxes are the interquartile ranges, the whiskers are the 5th to 95th percentiles, with the heavy black line representing the median.