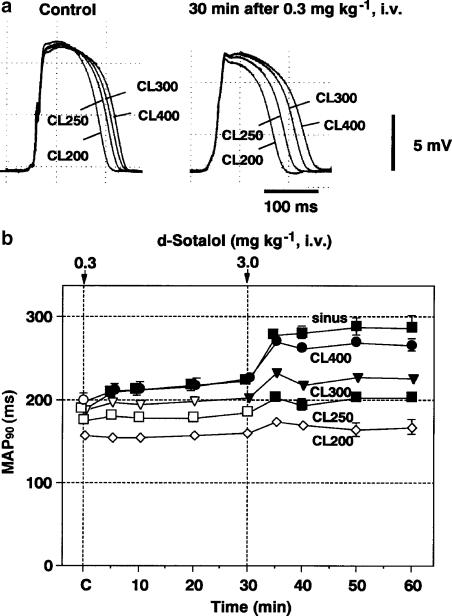
Figure 3.
Effects of D-sotalol on the MAPs recorded from the left ventricular muscle during the ventricular pacing. (a) Typical tracings of the MAP signals electrically driven at pacing cycle lengths of 200, 250, 300 and 400 ms (CL200, CL250, CL300 and CL400, respectively) before (Control) and 30 min after 0.3 mg kg−1 of D-sotalol injection. (b) Time courses of the effects of D-sotalol on the MAP duration at 90% repolarization level (MAP90). Data are presented as mean±s.e.m. (n=6). The closed symbols represent the significant differences from each predrug control (C) value by P<0.05.

