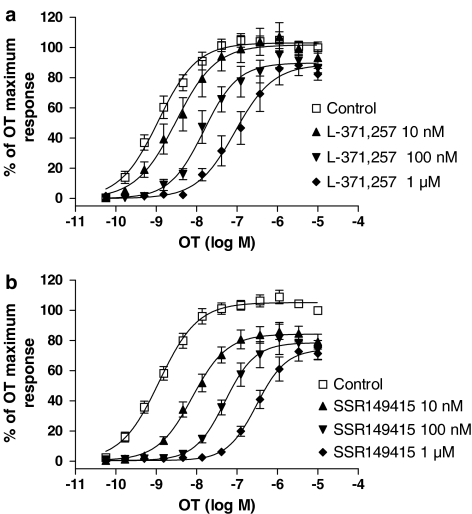
Figure 5.
Inhibition of OT-induced [Ca2+]i increase in hOT-CHO cells by L-371,257A and SSR149415. Concentration–response curves for OT in the absence or presence of 10 nM, 100 nM and 1 μM L-371,257 (a), or 10 nM, 100 nM and 1 μM SSR149415 (b). Curves depicted are the mean fit of three independent experiments performed in duplicate.

