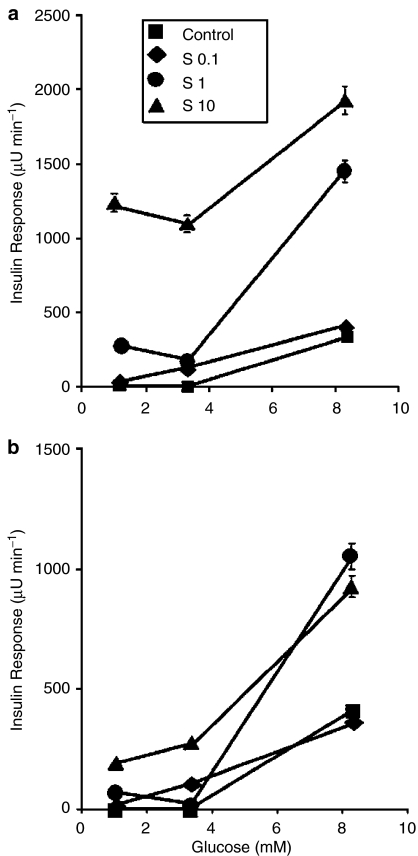
Figure 3.
Modulation by S 21403 of the dose–response relationships for glucose-induced first-phase (panel a) and second-phase (panel b) peak insulin responses. Part of the data derived from the experiments illustrated in Figure 2. Control denotes perfusion with glucose alone, S stands for S 21403. Mean±s.e.m. of five to six experiments; where not shown, the s.e.m. was smaller than the symbol.

