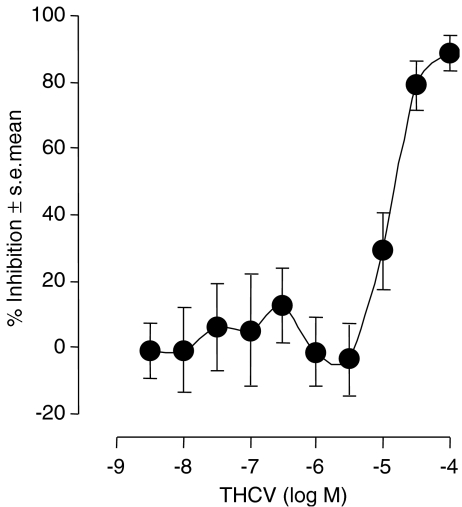
Figure 4.
The mean log concentration–response curve of THCV in the mouse isolated vas deferens. Each symbol represents the mean value±s.e.m. for inhibition of electrically evoked contractions expressed as a percentage of the amplitude of the twitch response measured immediately before the first addition to the organ bath of THCV. Tissues were exposed to THCV concentrations ranging either from 3.2 nM to 10 μM (n=10) or from 1 to 100 μM (n=10).

