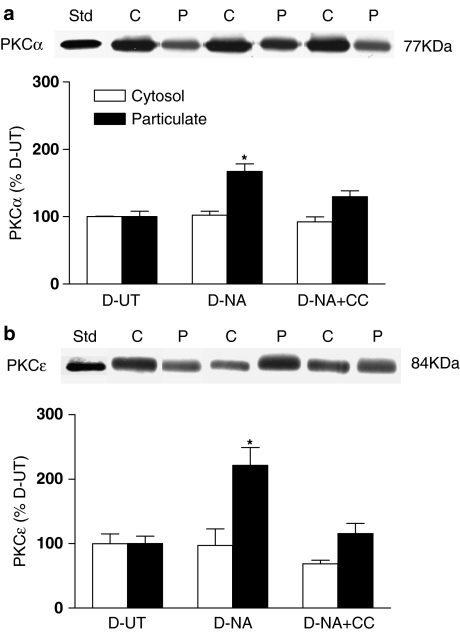
Figure 6.
The distribution of PKCα (a) and PKCɛ (b) in mesenteric arteries from diabetic rats (D) in the UT, in the presence of NA (30 μM for 7 min) and in the presence of NA plus calphostin C (NA+CC, 3 μM calphostin C for 35 min with 30 μM NA being added for the last 5 min). A representative Western blot showing cytosolic (C) and particulate (P) fractions is shown, together with a graph showing the mean±s.e.m. of data obtained from three different preparations. The first band on each blot represents the purified standard of the isoform (Std). Cytosolic (open bars) and particulate (filled bars) levels of PKC isoforms were calculated relative to levels of the same isoform in the corresponding fraction from untreated diabetic arteries. *P<0.05 compared to all other corresponding groups.

