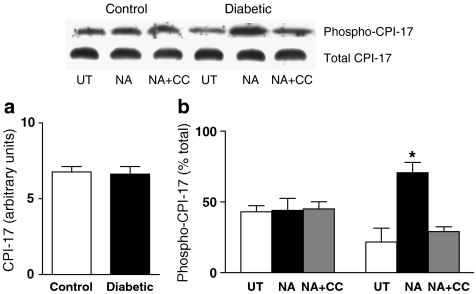
Figure 8.
Total levels of CPI-17 in control and diabetic arteries (a). Levels of phosphorylated CPI-17 in mesenteric arteries from control (C) and diabetic (D) rats in the untreated state (UT), in the presence of NA (30 μM for 5 min) and in the presence of NA plus calphostin C (NA+CC, 3 μM calphostin C for 35 min with 30 μM NA being added for the last 5 min) (b). A representative Western blot showing levels of total and phosphorylated CPI-17 is shown, together with a graph showing the mean±s.e.m. of data obtained from three different preparations. Levels of phosphorylated CPI-17 were expressed as a percent of total CPI-17 levels in each group. *P<0.05 compared to C-NA, C-NA+CC, D-UT and D-NA+CC (two-way ANOVA followed by Newman–Keuls post hoc test).

