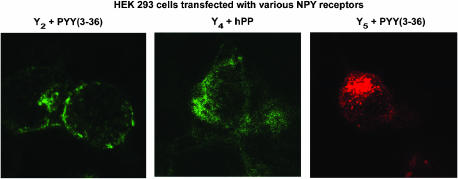
Figure 10.
Visualization of BODIPY®FL-PYY(3–36), BODIPY®FL-hPP and BODIPY®TMR-PYY(3–36) in HEK293 cells expressing the rat Y2, Y4 or Y5 receptor cDNA, respectively. Y2-expressing cells were incubated with 20 nM BODIPY®FL-PYY(3–36) (excitation 488 nm/emission 510 nm), Y4 cells were incubated with 20 nM BODIPY®FL-hPP (excitation 488 nm/emission 510 nm), and Y5 cells with 5 nM BODIPY®TMR-PYY(3–36) (excitation 543 nm/emission 580 nm) for 45 min at 37°C. Nonspecific binding represents signal obtained in the presence of 1 μM native peptide incubated under the same conditions with the fluorescent probe. Scale bar 10 μm. All images were taken using the same setting.

