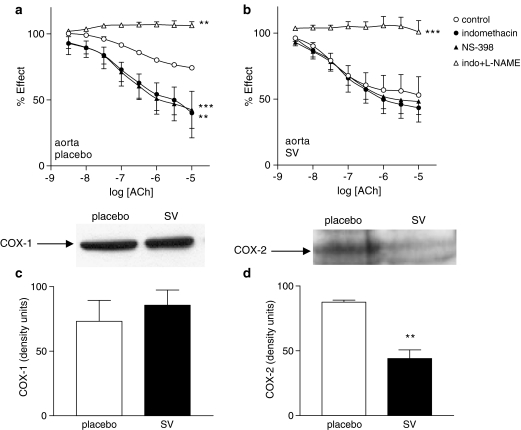
Figure 3.
Concentration–response curves to ACh of aortic rings from placebo- (a) and SV-treated (b) rats in the absence and presence of indomethacin (10−5 mol l−1), NS-398 (10−6 mol l−1) or indomethacin (10−5 mol l−1) plus L-NAME (3 × 10⁻⁴ mol l−1). Data represented are mean±s.e.m. of n=7. *P<0.05; **P<0.01; ***P<0.001 control versus curve in the presence of inhibitor. Representative Western blot and bars showing optic densitometry of n=4 blots of aortic COX-1 (c) and COX-2 (d). **P<0.01 placebo versus SV.

