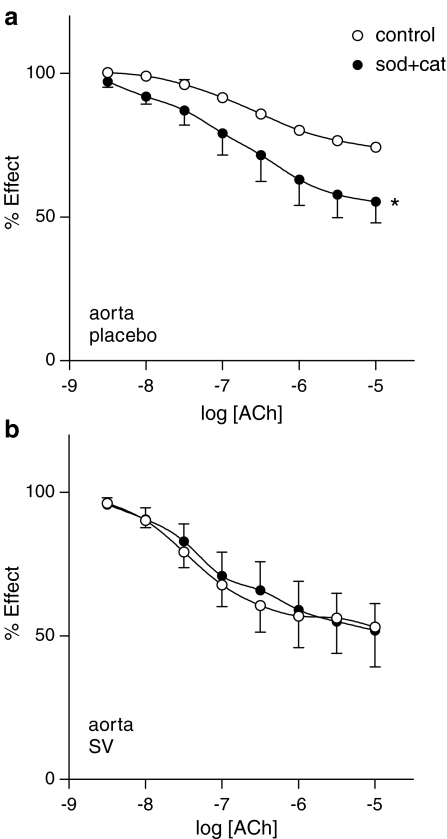
Figure 5.
Concentration–response curves to ACh in aortic rings from placebo- (a) and SV-treated (b) rats in the absence and presence of ROS scavengers SOD (150 UI ml−1) plus catalase (1000 UI ml−1). Data represented are mean±s.e.m. of n=7. *P<0.05; **P<0.01 control versus curve in the presence of inhibitor.

