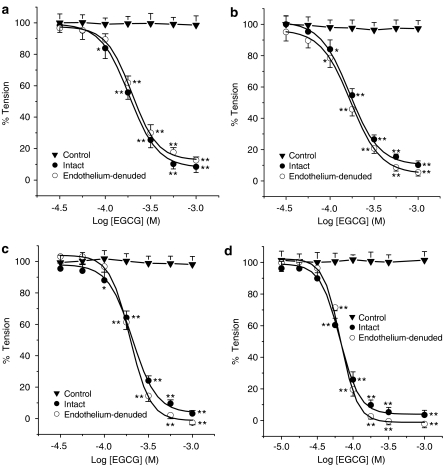
Figure 2.
Cumulative concentration–relaxation curves for EGCG (1 μM–1 mM) in intact and endothelium-denuded rat thoracic aortic rings precontracted with NA (1 μM, panel a), PMA (1 μM) in 1.5 mM Ca2+-containing solution (panel b) and in Ca2+-free medium (panel d) or high extracellular KCl concentration (60 mM, panel c). Each point represents the mean value±s.e.m. (indicated by vertical bars) from five experiments. Level of statistical significance: *P<0.05 or **P<0.01 with respect to the maximal tension (Emax=100%).

