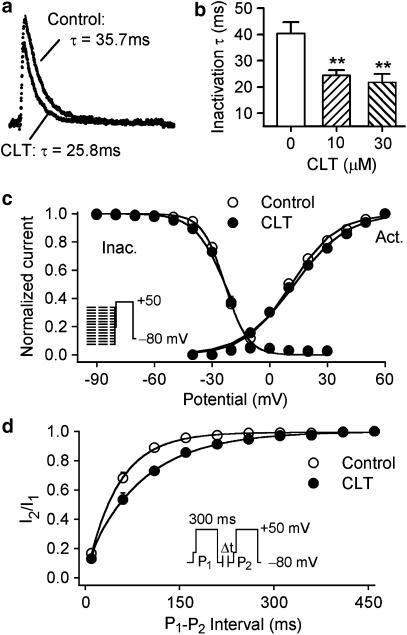
Figure 3.
Effects of CLT on the kinetics of Ito1. (a) Ito1 traces recorded from a representative cell upon a 300-ms voltage step from −50 to +50 mV in the presence of 10 μM verapamil (control) and co-presence of verapamil and 10 μM CLT. Raw data (points) of Ito1 were fitted to a mono-exponential function (solid lines, superimposed with raw data) with time constants shown. (b) Mean values of time constants at +50 mV during control, in the presence of 10 and 30 μM CLT. The time constant was reduced by the application of 10 and 30 μM CLT (n=6, **P<0.01 vs control). (c) Normalized voltage-dependent variables for Ito1 activation (Act.) and inactivation (Inact.) were fitted to Boltzmann distribution: y=1/{1+exp[(Vm−V0.5)/S], where Vm is the membrane potential, V0.5 is the midpoint, and S is the slope. V0.5 for activation conductance of Ito1 was 10.9±1.0 mV for control and 12.1±1.3 mV for 10 μM CLT (n=6, P=NS), while S was 12.5±1.0 and 13.8±1.7 mV for control and CLT, respectively (P=NS). For inactivation, V0.5 and S were −23.3±0.4 and −5.9±0.5 mV during control, −23.5±0.6 and −7.9±0.6 mV with 10 μM CLT (n=6, P=NS). (d) Recovery of Ito1 from inactivation was determined by 300-ms paired pulses from −80 to +50 mV after a 30-ms step of −40 mV (to inactivate INa) with varying P1 and P2 interval (inset). Data were fitted to bi-exponential functions. Recovery time constants (τ1 and τ2) of Ito1 were decreased by the application of 10 μM CLT (n=6, P<0.01).

