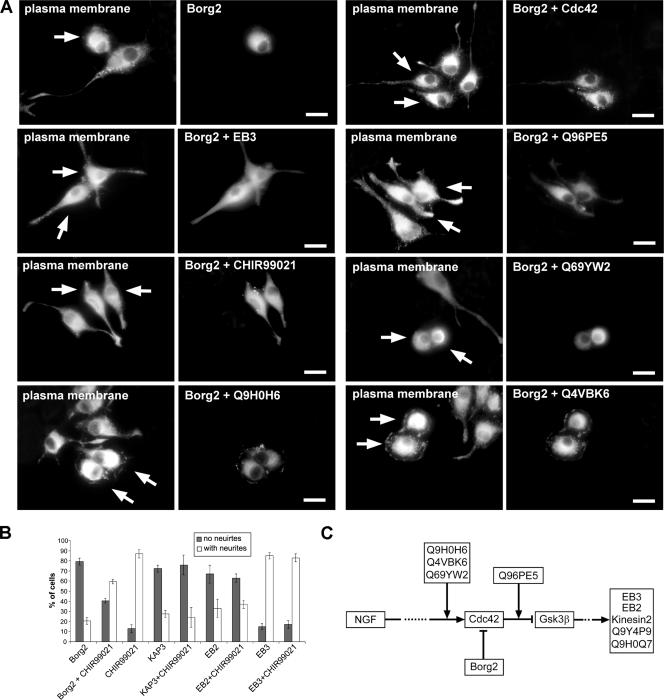
Figure 5.
Analysis of the functional relationship between Borg2/Cdc42, Gsk3β and other proteins identified in the screen. (A) Cells were cotransfected with Borg2 and other proteins identified in the screen as described in Materials and Methods. Each panel consists of two pictures: one shows ConA-Alexa647 staining of the plasma membrane to highlight the outline of the cell and the second shows the overexpression of Borg2 alone and coexpression of Borg2 with Cdc42, EB3, Q96PE5, CHIR99021, Q69YW2, Q9H0H6 and Q4VBK6, respectively. Note that Q4VBK6, Q9H0H6, Q69YW2 were unable to rescue Borg2 phenotype while Q96PE5, EB3, CHIR99021 and Cdc42 were able to partially rescue the Borg2 phenotype when coexpressed. Arrows point to cotransfected cells. Scale bars, 10 μm. (B) Cells were transfected with indicated proteins as described in Materials and Methods and treated with NGF with or without the presence of 2 μM CHIR99021. Shown is the percentage of cells with and without neurites. Error bars represent the SD of the mean of at least two independent experiments. Ten images with 20× objective were acquired and a minimum of 150 cells were counted. (C) A schematic summary of the experiments addressing a functional relationship between the effector proteins identified.

