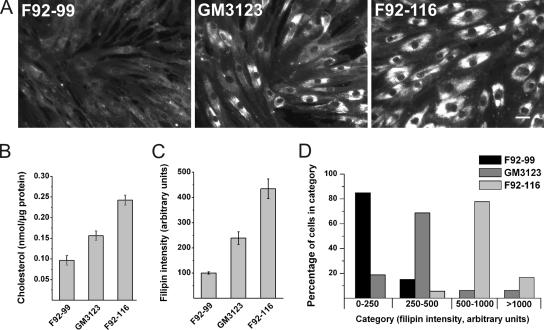
Figure 1.
Characterization of human NPC1 fibroblast lines used in the study. (A) Filipin staining of control (F92-99) and two NPC1 patient fibroblast lines (GM3123 and F92-116). (B) Free cholesterol levels were measured biochemically (n = 6 from two independent samples for each cell line). (C) Intensity of filipin staining in a cell population (n = 40). (D) Individual cells grouped into categories based on filipin staining intensity. Bar, 40 μm.

