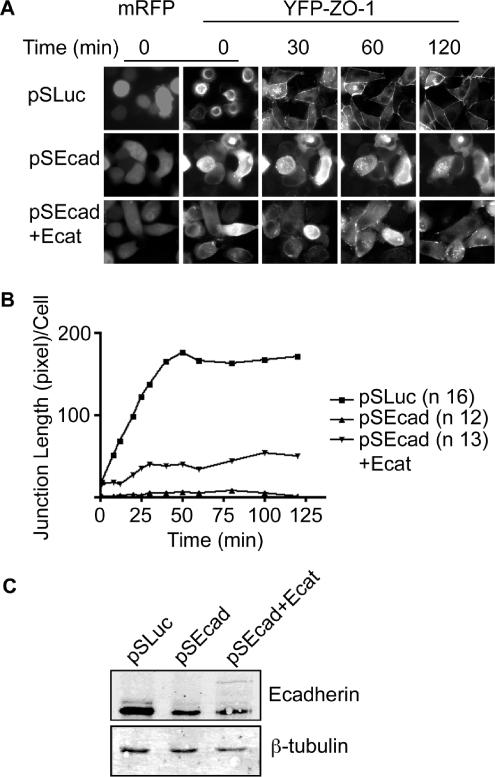
Figure 9.
E-cadherin knockdown is partially rescued by E-cadherin–α-catenin fusion protein. (A) Live cell time-lapse imaging of YFP-ZO-1 MDCK cells after calcium switch. Cells were transfected with vectors for control or E-cadherin shRNAs or the E-cadherin–α-catenin fusion protein (Ecat). mRFP marks transfected cells. Videos are available in Supplementary Material. (B) Quantification of ZO-1 length as a measure of TJ recovery (pixels per cell). Average lengths are recorded up to 120 min after calcium switch for control cells (■) E-cadherin depleted cells (▴) and depleted cells plus an E-cadherin–α-catenin fusion protein (▾). (C) Immunoblot of cell lysates from YFP-ZO-1 cells transfected with pSLuc, pSEcadB, or pSEcadB vectors plus the E-cadherin–α-catenin fusion protein.

