Figure 3.
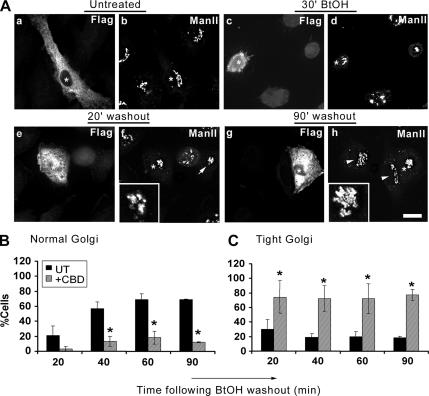
Overexpression of the AP180 clathrin binding domain: effects on the reformation of the Golgi apparatus. (A) NRK cells were transiently transfected with cDNA encoding the FLAG-tagged CBD of AP180. Transfected cells were detected using a polyclonal anti-FLAG antibody, and the Golgi apparatus was visualized with an anti-ManII antibody. Untreated, ManII displays a characteristic lace-like distribution and juxtanuclear localization in both transfected (A, a, asterisk) and untransfected cells (A, b, asterisk) and a fragmented morphology in treated cells (30′ BtOH; d). During washout, ManII reforms with an initial tight intermediate morphology (20′ washout; f) in both transfected (asterisk and inset) and untransfected cells (arrow). At later times (90′ washout; h), the Golgi apparatus regains its normal morphology in untransfected cells (arrowheads); however, it maintains a tight intermediate conformation in transfected cells (asterisks and inset). (B and C) Quantitation of Golgi morphologies during BtOH washout. Golgi morphologies were defined as normal or tight intermediate and were counted by two independent observers by scoring untransfected and transfected cells from three different experiments. (B) Frequency of normal morphology in untransfected (black bars) or transfected cells (gray bars) at the indicated times after BtOH removal. (C) Frequency of the tight structure in untransfected (black bars) or transfected cells (gray bars). Asterisks indicate statistically significant differences from untransfected cells (p < 0.05, Student's t test). Bar, 10 μm.

