Figure 4.
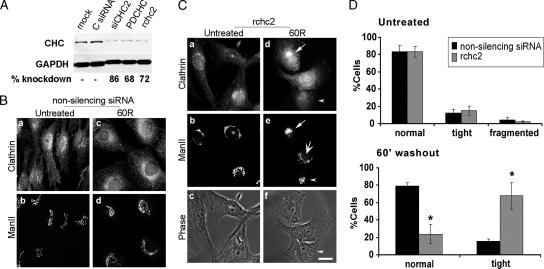
Diminished CHC protein leads to persistence of the compact Golgi structure. (A) NRK cells were either mock-transfected or treated with a control, nonsilencing siRNA (C siRNA) or with three different specific CHC siRNAs for 3 d. Ten micrograms of total homogenate was resolved by SDS-PAGE followed by Western blotting by using mouse anti-clathrin and mouse anti-GAPDH, the latter as a loading control. The bands were quantified with Quantity One (Bio-Rad, Hercules, CA), and CHC knockdown levels are shown below the blots. NRK cells were transfected with control nonsilencing siRNA (B) or CHC siRNA (rchc2) (C) for 3 d, after which they were either untreated or treated with 1% 1-BtOH for 30 min followed by washout in normal medium for 60 min (30 min BtOH; 60R). Both samples were processed for immunofluorescence with antibodies to ManII and clathrin. Arrow (d and e), clathrin recruitment and corresponding Golgi tight intermediate in untransfected cell; also, note fully reformed Golgi in normal cell (large arrow; e); arrowhead, tight Golgi morphology in rchc2-transfected cell (d–f); asterisk, clathrin knockdown cell (a–c); note that the polyclonal anti-clathrin antibody used here displayed nonspecific staining in CHC knockdown cells (for knockdown efficiency, see Supplemental Figure 3). Clathrin knockdown cells were identified as cells displaying low, background levels of staining and no specific subcellular localization. Bar, 20 μm. (D) Quantitation of Golgi morphologies: ∼150 normal or CHC knockdown cells in each of four experiments were scored by two independent observers. Asterisks indicate statistically significant differences from untransfected cells (p < 0.05, Student's t test). Bar, 10 μm.

