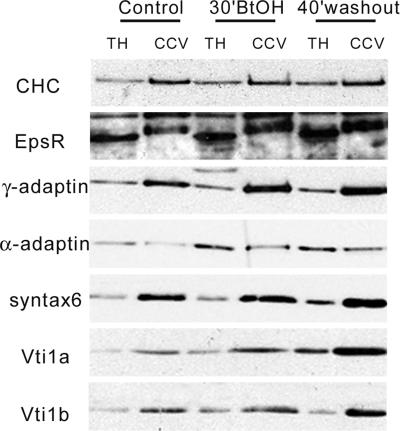
Figure 8.
Characterization of isolated clathrin-coated vesicles. CCVs were isolated from control, BtOH-treated (30′BtOH), and 40′ washout GH3 cells as described previously (Hirst et al., 2004). Ten micrograms of protein from total homogenates (TH) or the CCV fraction (CCV) were analyzed by SDS-PAGE, transferred to PVDF membranes, and probed with antibodies to the indicated proteins.

