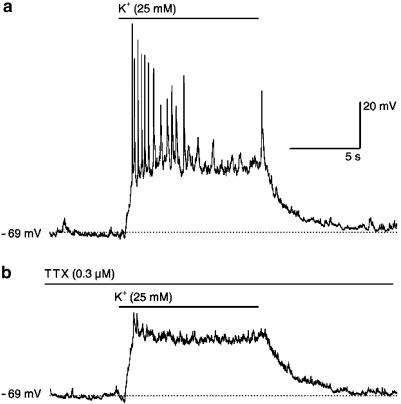
Figure 2.
Effects of high K+ (25 mM) on the membrane potential of rat cortical neurons. Membrane potential was measured under current clamp in the whole cell configuration of the patch-clamp technique. The figure shows responses in a representative control neuron grown in 5 mM K+, which, however, were qualitatively and quantitatively similar to the responses obtained in neurons grown in high K+ (25 mM; see Results). The high K+ (25 mM)-containing bath solution was pressure-applied two times for 10 s to the neurons under investigation, first in the absence of TTX (a) and second after 2 min of superfusion and in the continued presence of TTX (0.3 μM; b). Horizontal lines above membrane potential traces indicate times of high K+ and TTX application. Dotted lines indicate the membrane potential (−69 mV) of the cell. Fast vertical deflections are action potentials, which may not be resolved in their full height due to the low sampling frequency (3 kHz).

