Figure 6.
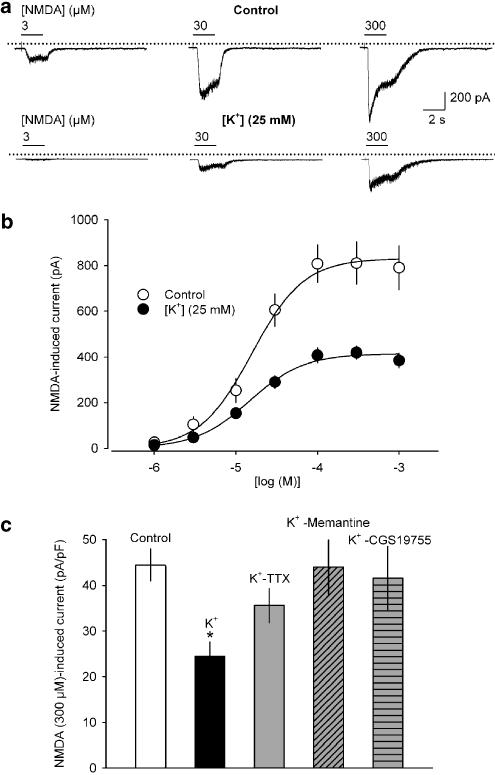
NMDA-induced transmembrane currents in rat cortical neurons cultured under control conditions and treated with 25 mM K+. (a) Representative inward currents in response to increasing concentrations of NMDA (3, 30 and 300 μM) at a holding potential of −70 mV in neurons treated either with 5 mM K+ (control, upper panel) or 25 mM K+ (lower panel). The dotted lines indicate zero current level; horizontal bars above the current traces indicate times of NMDA application. (b) Concentration–response curves of NMDA (1–1000 μM, plus 10 μM glycine) in control (○) and high K+-treated cultures (•). (c) NMDA (300 μM) induced current amplitudes obtained for controls (control), high K+ (K+), high K+ plus 3 μM TTX (K+-TTX), high K+ plus 50 μM memantine (K+-Memantine) and high K+ plus 50 μM CGS 19755 (K+-CGS 19755). The respective current densities (peak current amplitudes divided by whole-cell capacitance) are shown. Means±s.e.m. of n=7–21 experiments are given in (b) and (c). Significant differences vs control: *P<0.01.

