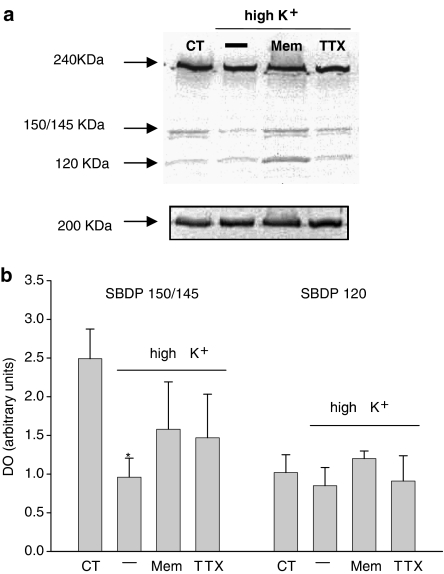
Figure 8.
Western blot analysis of α-spectrin breakdown in cortical neurons. Total protein was extracted from cortical neurons (DIV10) exposed to 5 mM K+ (control), 25 mM K+, 25 mM K+ plus either TTX (3 μM) or memantine (50 μM); 20 μg of protein was loaded on each lane. (a) Full-lengh α-spectrin is represented by the 240 kDa band. Calpain activation is specifically indicated by formation of α-spectrin breakdown product SBDP145; caspase-3 activation is specifically indicated by the 120 kDa fragment SBDP120. Fragment SBDP150 indicates both calpain and caspase-3 activation. A representative blot is given. (b) Bar chart representing a semiquantitative densiometric band analysis of SBDP150/145 and SBDP120 in the same experimental conditions. The bands were normalized to myosin (200 kDa) levels and expressed as arbitrary units. Histograms represent mean±s.e.m. from 4–6 different cultures. Significant differences vs respective controls: *P<0.05.

