FIGURE 4.
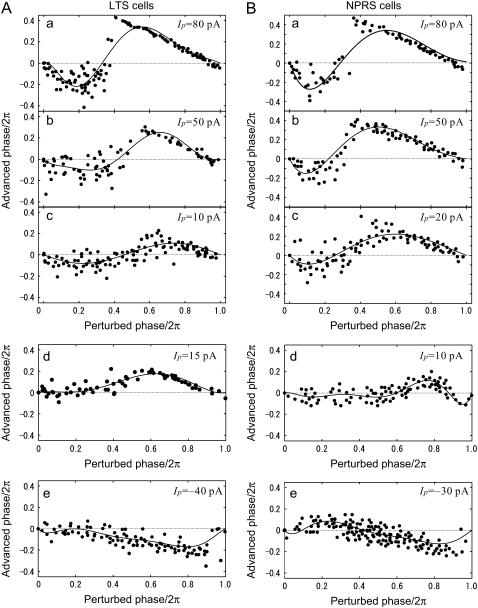
Phase resetting curves for three of LTS and NPRS cells. (A) LTS cells. For an LTS cell, dependency of biphasic PRCs on perturbation magnitude is shown in a, b, and c. The depolarizing current-step (Id) was 200 pA and the magnitude of perturbation (Ip) was 80, 50, and 10 pA (top to bottom). (d and e) For two other LTS cells, monophasic PRCs for positive perturbations (d, Ip = 15 pA) and negative perturbation (e, Ip = −40 pA). (B) NPRS cells, biphasic PRCs at three perturbation magnitudes. The perturbation magnitude Ip was, respectively, 80, 50, and 20 pA in a, b, and c. (d and e) For two other NPRS cells, monophasic and biphasic PRCs are shown, for positive (d, Ip = 10 pA) and negative (e, Ip = −30 pA) perturbations, respectively.

