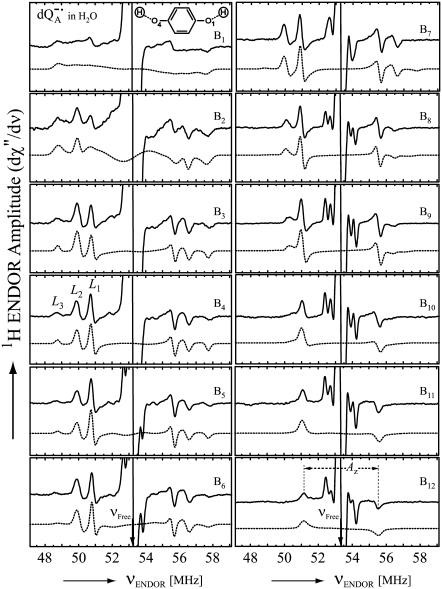
FIGURE 3.
Experimental (solid lines) and simulated (dotted lines) 1H ENDOR spectra of  in H2O, at 35 GHz, at 12 different magnetic field positions of the EPR spectrum (see arrows in Fig. 2 a). In the fitting of the spin Hamiltonian to the data the frequency range between 51.5 MHz and 55.0 MHz was excluded. The H-bond ENDOR lines L1, L2, L3 are labeled in (B4). The hfc splitting Az is shown by an arrow in (B12). Experimental conditions: T = 80 K, MW power = 3 × 10⁻⁶ W, and frequency modulation (FM) = ±140 kHz at a rate of 947 Hz. Number of scans per position: 600. Scan time: 4 s.

