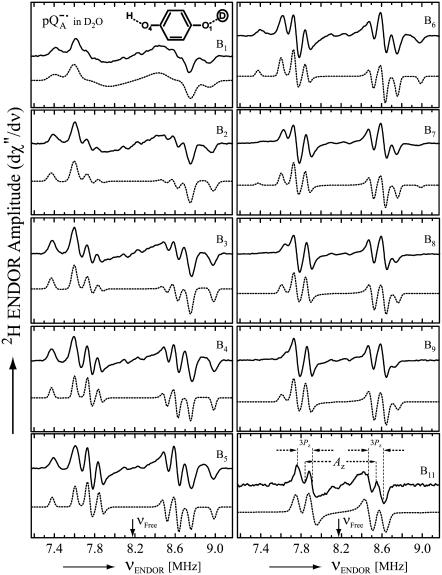
FIGURE 4.
Experimental (solid lines) and simulated (dotted lines) 2H ENDOR spectra of  at 35 GHz in RCs prepared in H2O and incubated for 50 min in D2O (see (19)), at 10 different magnetic field positions of the EPR spectrum (see arrows in Fig. 2 b). Inset shows the preferential deuteration of the bond to O1. The quadrupolar splittings 3Pz and hyperfine splitting Az are shown by arrows in the single-crystal-type spectrum at position B11. Experimental conditions: T = 80 K, MW power = ∼5 × 10⁻⁶ W, and FM = ±30 kHz at a rate of 985 Hz. Number of scans per position: 45,000. Scan time: 4 s.

