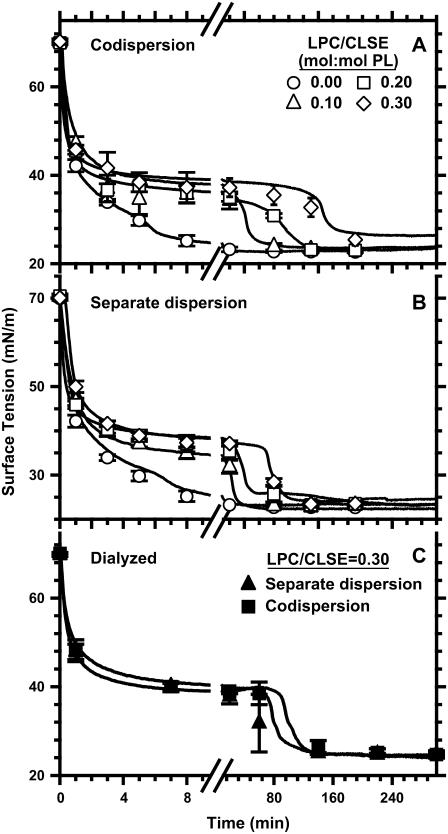
FIGURE 6.
Adsorption of CLSE in the absence and presence of LPC. Curves show the variation of surface tension after removal of the surface film from a dispersion of 100 μM surfactant phospholipid at 37°C in HSC buffer. Curves are representative of three experiments under the same conditions. Symbols give mean ± SD at specific times to indicate the variation among different experiments. (A) LPC and CLSE dispersed separately and then combined. (B) LPC and CLSE mixed and then dispersed together. (C) Samples prepared by both methods of combination and then dialyzed.

